

With the holidays behind us and a new year ahead, it’s time to reset our goals and find ways to make our lives healthier and happier. This time last year, like many people, I decided to create a more regimented exercise routine and track my progress. I looked at several fitness and workout apps I could use, but none of them let me track my workouts exactly the way I wanted to—so I made my own, all without writing any code.
If you’ve found yourself in a similar situation, don’t worry: Using AppSheet, Google Cloud’s no-code app development platform, you can also build a custom fitness app that can do things like record your sets, reps and weights, log your workouts and show you how you’re progressing.

To get started, copy the completed version here. If you run into any snags along the way or have questions, we’ve also started a thread on AppSheet’s Community that you can join.
Step 1: Set up your data and create your app
First, you’ll need to organize your data and connect it to AppSheet. AppSheet can connect to a number of data sources, but it’ll be easiest to connect it to Google Sheets, as we’ve built some nifty integrations with Google Workspace. I’ve already set up some sample data. There are two tables (one on each tab): The first has a list of exercises I do each week and the second is a running log of each exercise I do and my results (such as the weight used and my number of reps).
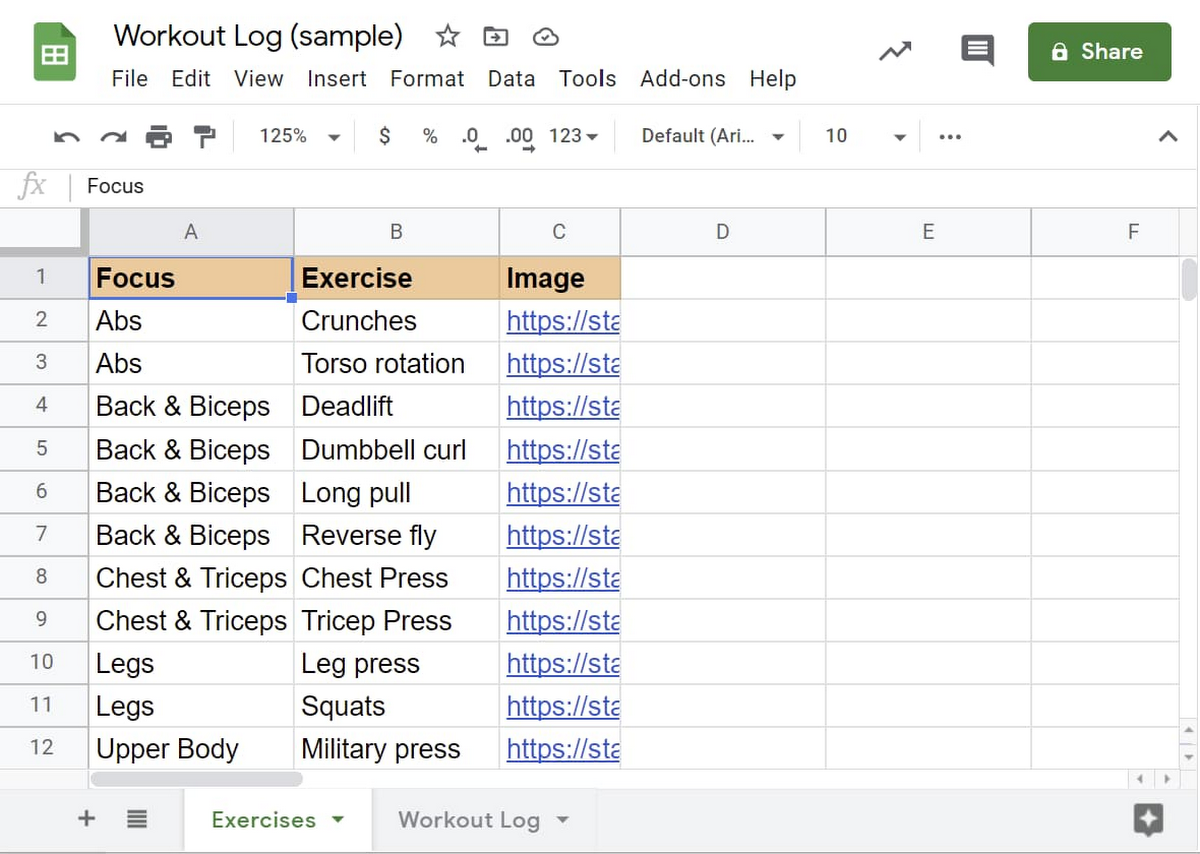
Feel free to copy this Sheet and use it to start your app. Once you’ve done that, you can create your app directly from Google Sheets. Go to Tools>AppSheet>Create an App and AppSheet will read your data and set up your app. Note that if you’re using another data source, you can follow these steps to connect to AppSheet.
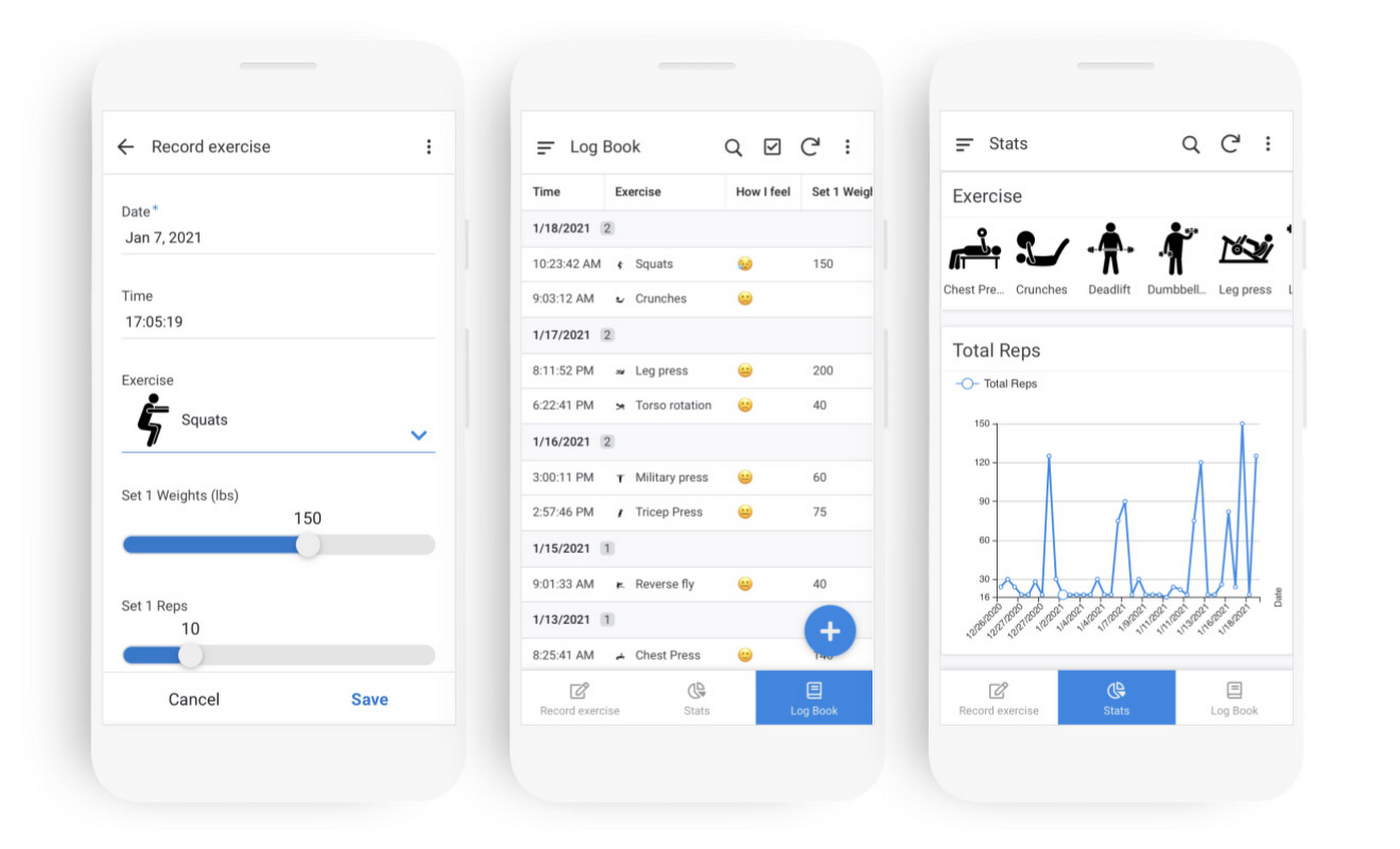
Step 2: Create a form to log your exercises
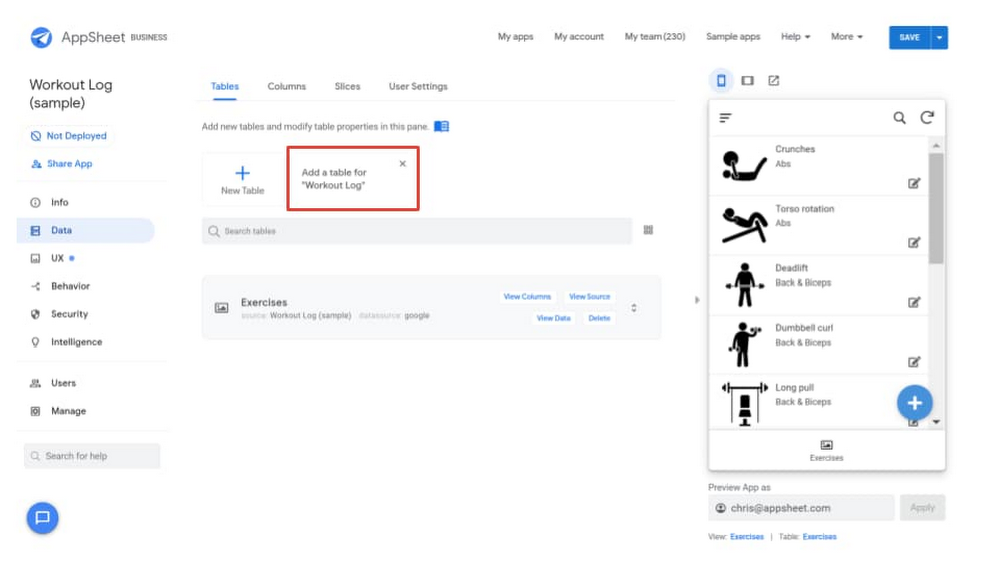
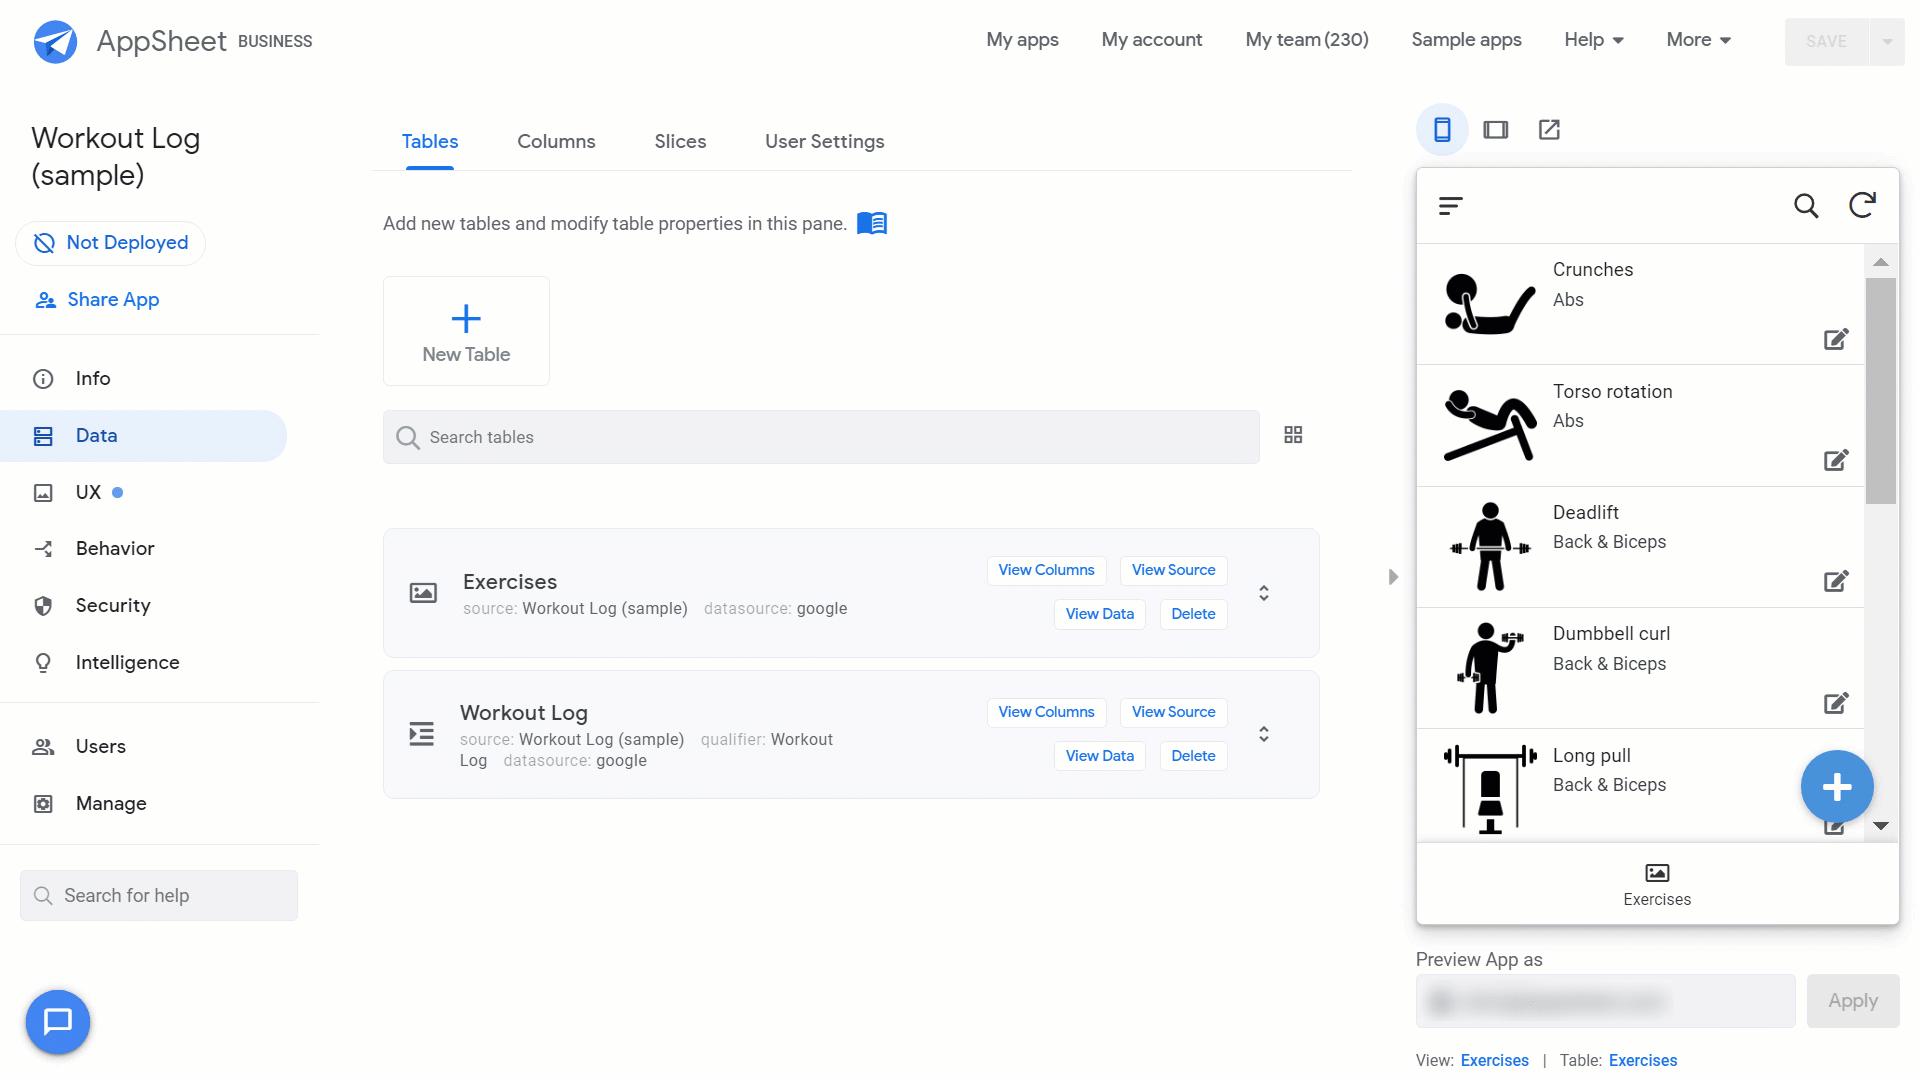
You should now be in the AppSheet editor. A live preview of your app will be on the right side of your screen. At this point, AppSheet has only connected to one of the two tables we had in our spreadsheet (whichever was open when we created our app), so we’ll want to connect to the other by going to Data>Tables>”Add table for “Workout Log.”
Before creating the form, we need to tell AppSheet what type of data is in each column and how that data should be used. Go to Data>Columns>Workout Log and set the following columns with these settings (you can adjust column settings by clicking on the Pencil icon to the left of each column):
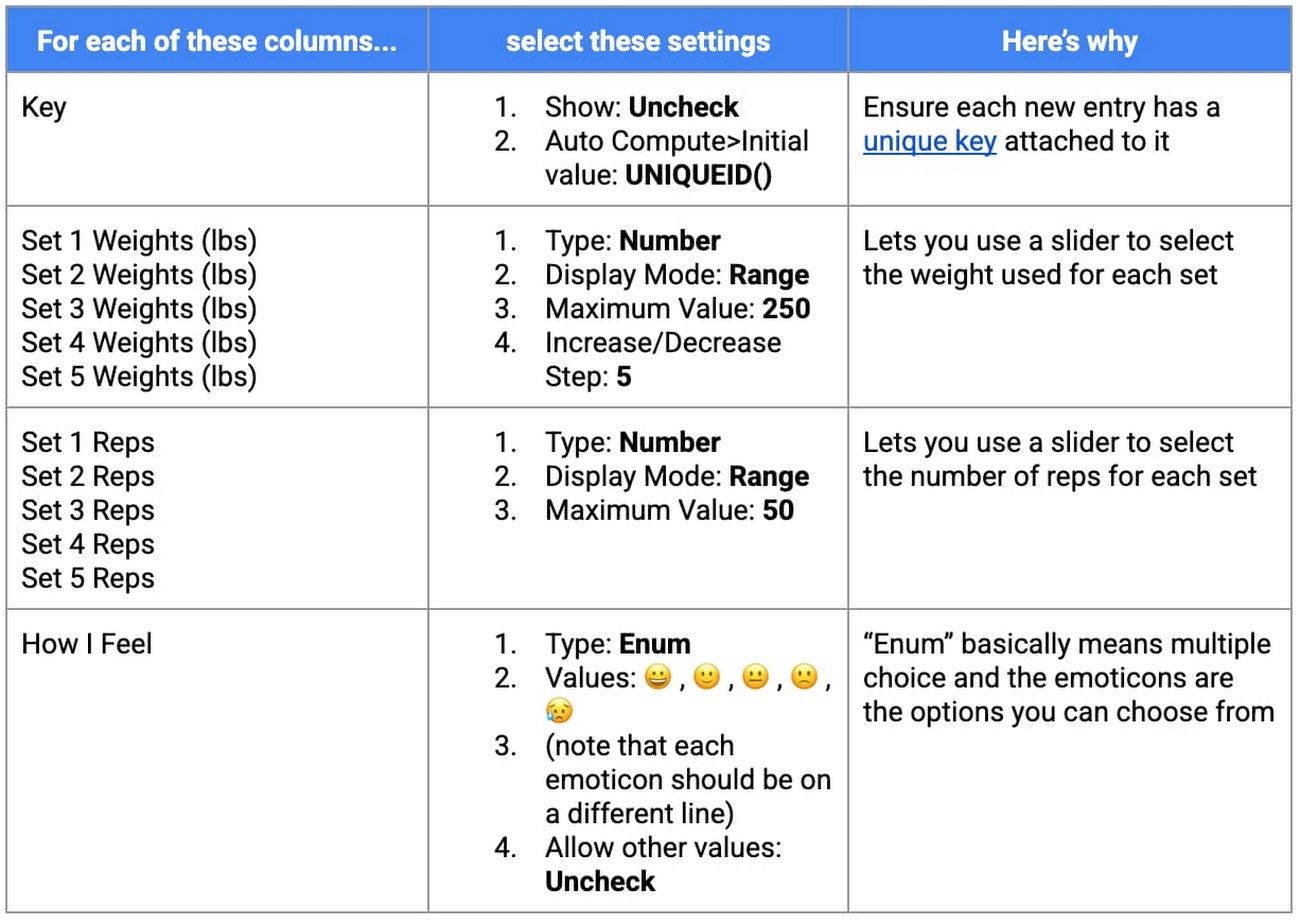
This image shows how I adjusted the settings for “Key,”,“Set 1 Weights (lbs),” “Set 1 Reps,” and “How I Feel.”
Now let’s create a View for this form. A view is similar to a web page, but for apps. Go to UX>Views and click on New View. Set the View name to “Record Exercise”, select “Workout Log” next to For this data, set your View type to “form,” and set the Position as “Left.” Now, if you save your app, you should be able to click on “Record exercise” in your app and it will open up a form where you can log your exercise.
Step 3: Set up your digital workout log book
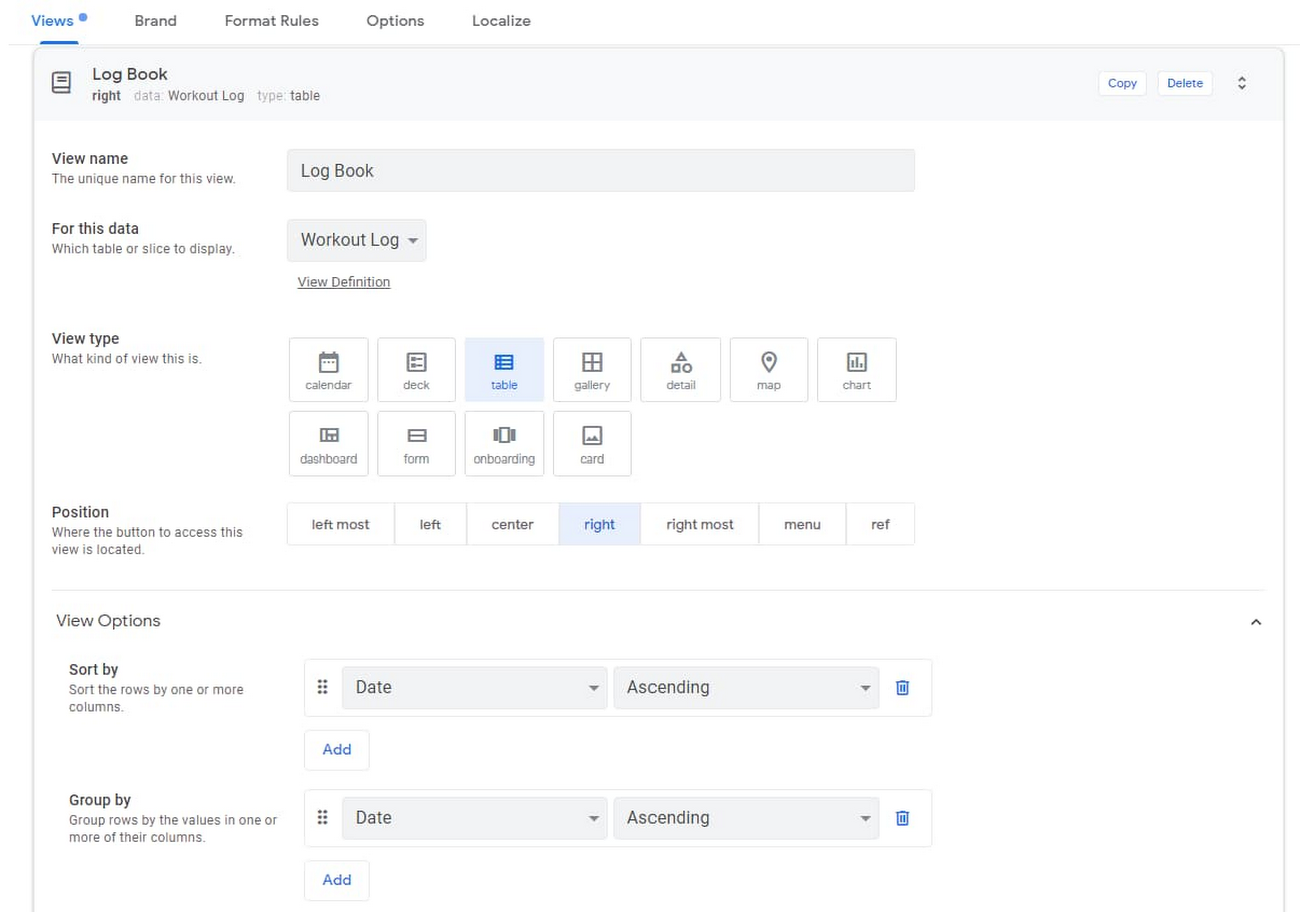
I like to quickly see past workouts while I’m exercising to know how many reps and weights I should be doing. To make our workout log book, we’ll want to create a new view. Go to UX>View and click on New View. Name this view “Log Book,” select “Workout Log” as your data, select “Table” as the View Type, and set the Position to “Right.”
Then, in the View Options section, choose Sort by “Date,” “Ascending and Group by “Date,” “Ascending.”
Step 4: Create your Stats Dashboard
At this point, we already have a working app that lets us record and review workouts. However, being the data geek I am, I love using graphs and charts to track progress. Essentially, we’ll be making an interactive dashboard with charts that will show stats for whichever exercise we select. This step is a little more involved, so feel free to skip it if you’d like—it is your app after all!
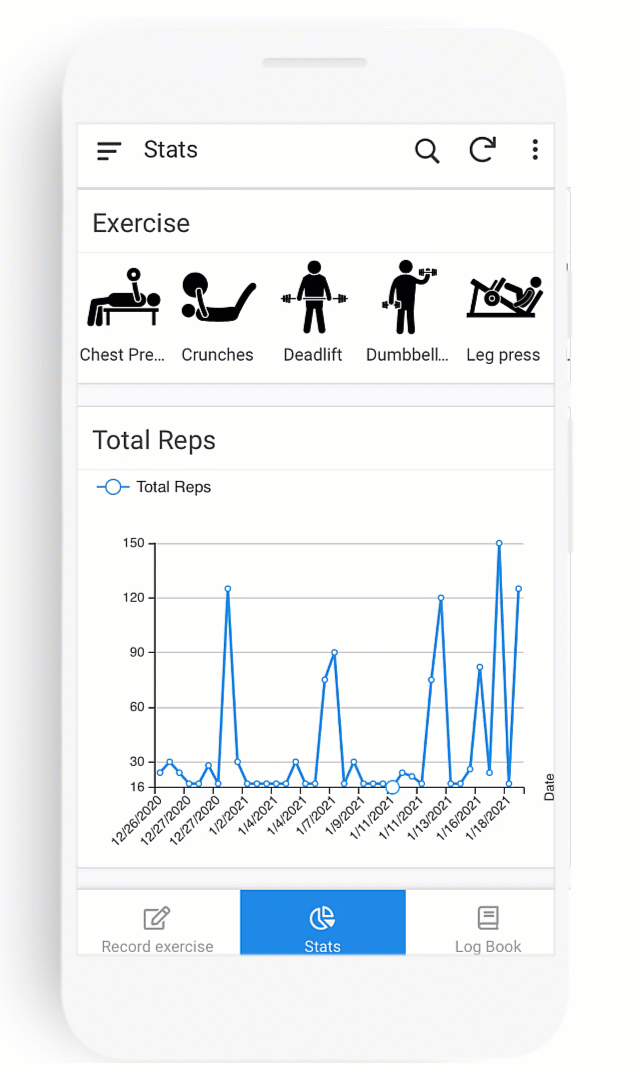
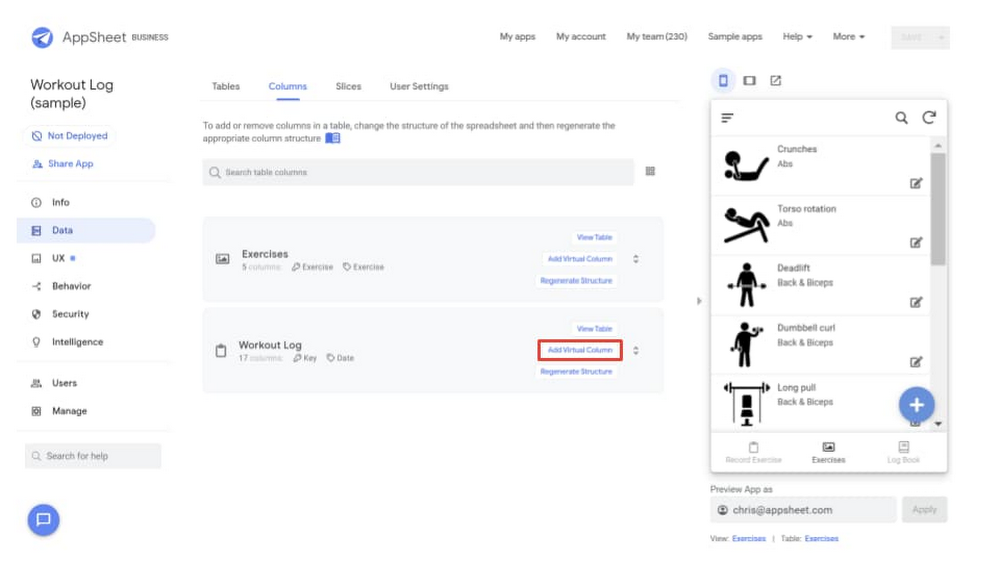
Before we make the Dashboard view, we need to decide what metrics we want to see. I like to see the total number of reps per set, along with the amount of weight I lifted in my first set. We already have a column for weights (Set 1 Weights (lbs)), but we’ll need to set up a virtual column to calculate total reps. To do this, select Data>Columns>Workout Log>Add Virtual Column.
For advanced logic, such as these calculations, AppSheet uses expressions, similar to those used in Google Sheets. Call the Virtual Column “Total Reps” and add this formula in the pop up box to calculate total reps:
[Set 1 reps] + [Set 2 reps] + [Set 3 reps] + [Set 4 reps] + [Set 5 reps]
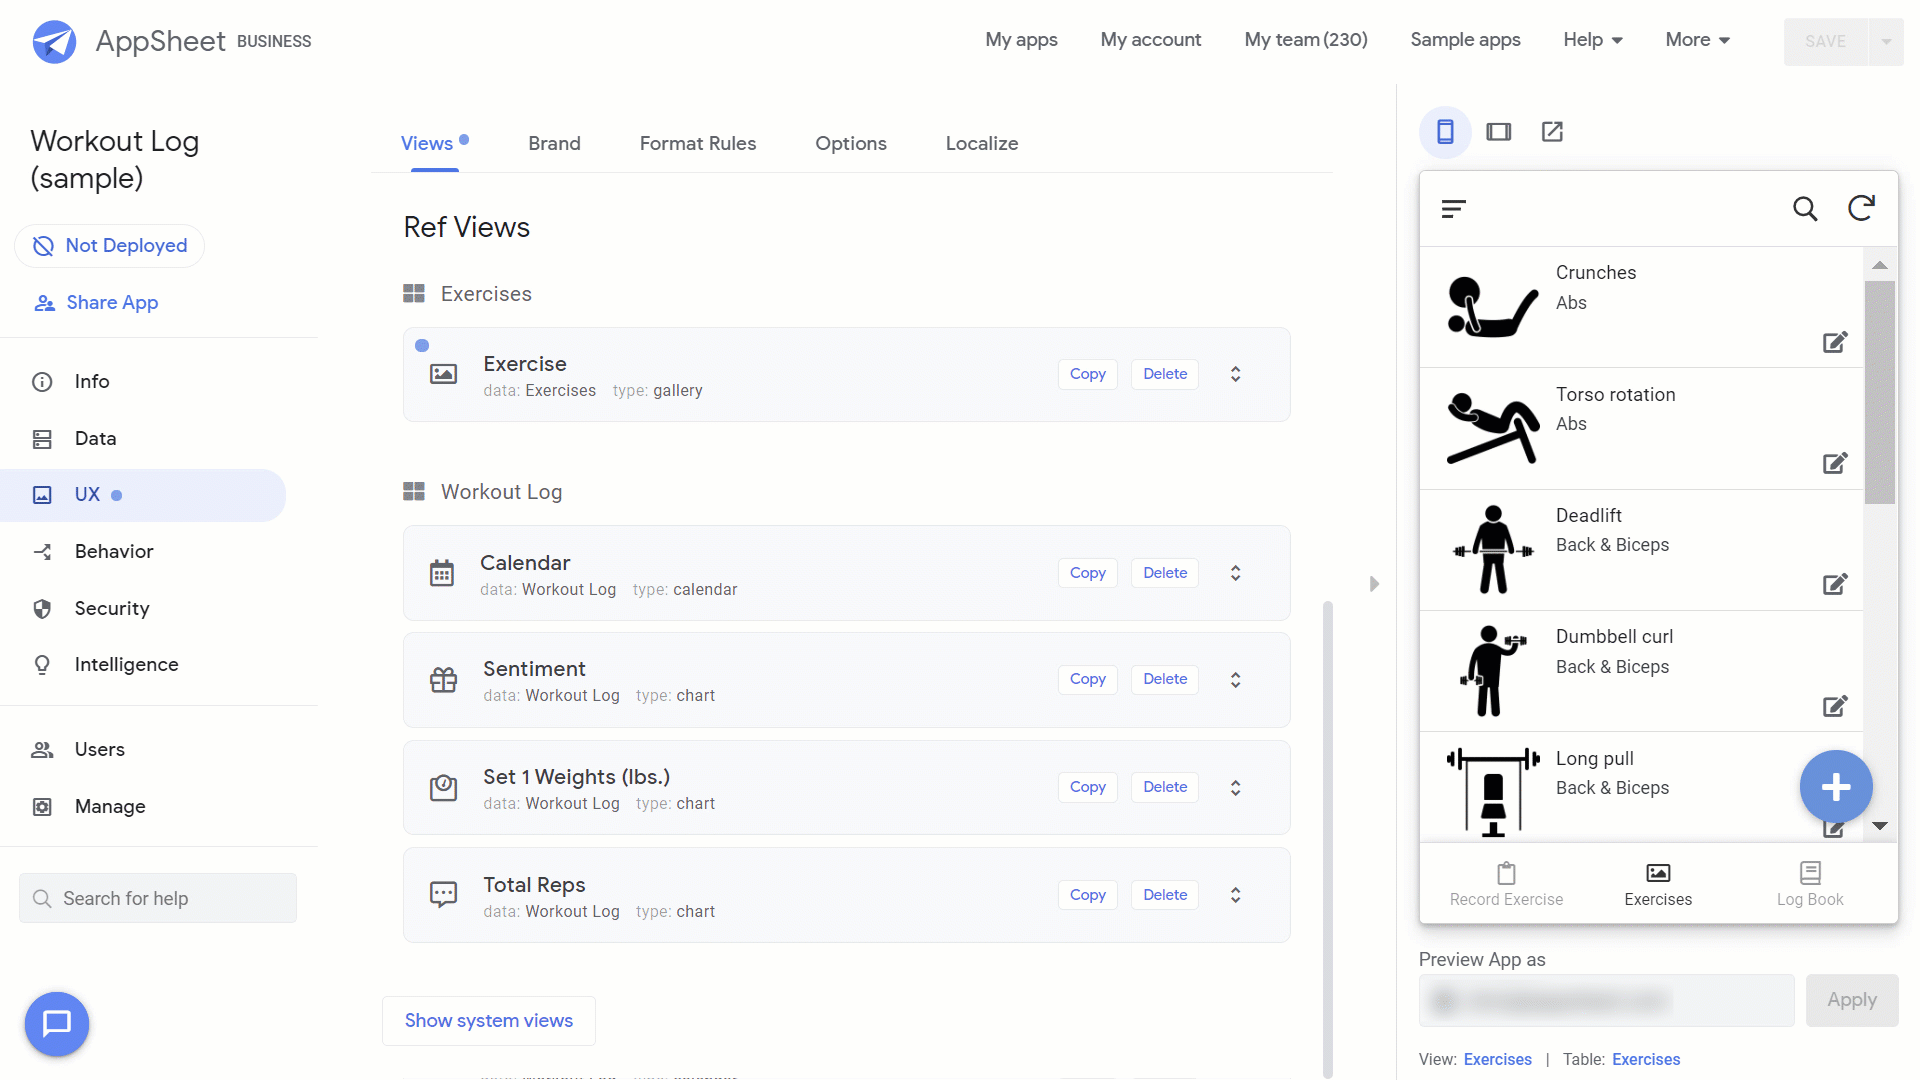
Now we can work on creating our Dashboard view. In AppSheet, a Dashboard view is basically a view with several other views inside it. So before we create our dashboard, let’s create the following views.
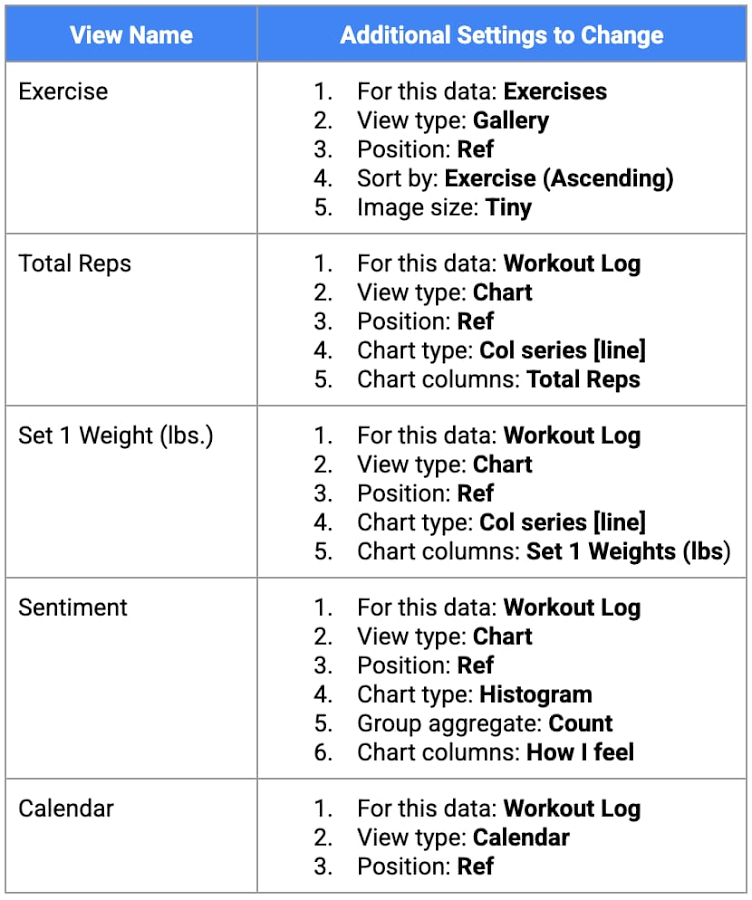
Now we can create our Dashboard view. Let’s call the View “Stats,” set the View type to “Dashboard,” and Position to “Center.” For View Entries, we’ll select “Exercise” (not Exercises!) “Total Reps,” “Set 1 Weight (lbs.),” “Sentiment,” and “Calendar.” Enable Interactive Mode and under Display>Icon type “chart” and select the icon of your choosing. Hit Save, and you should now have a pretty neat dashboard that adjusts each chart based on the exercise you select.
Step 5: Personalize your app and send it to your phone!
Now that your app is ready, you can personalize it by adjusting the look and feel or adding additional functionality. At this point, feel free to poke around the AppSheet editor and test out some of the functionality. For my app, here’s a few of the customizations I added.
- I went to UX>Brand and changed my primary color to Blue.
- I went to Behavior>Offline/Sync and turned on Offline Use so that I can use my app when I don’t have an internet connection.
- I changed the position of my Exercises view to Menu, so it only appears in the Menu in the top-left corner of my app.
Once you’ve adjusted your app the way you want it, feel free to send it to your phone. Go to Users>Users>Share App, type in your email address next to User emails, check “I’m not a robot” and select “Add users + send invite.” Now check your email on your phone and follow the steps to download your app!
AppSheet offers plenty of ways to simplify your life by building apps—see what other apps you can make. Happy app building!