Most growing businesses don’t have a data problem. They have an answers problem.
Google Ads has its own report. So do Google Analytics, YouTube, Facebook and your listings platform. Then there are the channels that never show up in a report at all: the referral from a regular, the hotel concierge sending guests your way, the billboard on the highway. And now there’s AI search, where people ask ChatGPT or Google’s AI where to eat, who to hire or what to buy.
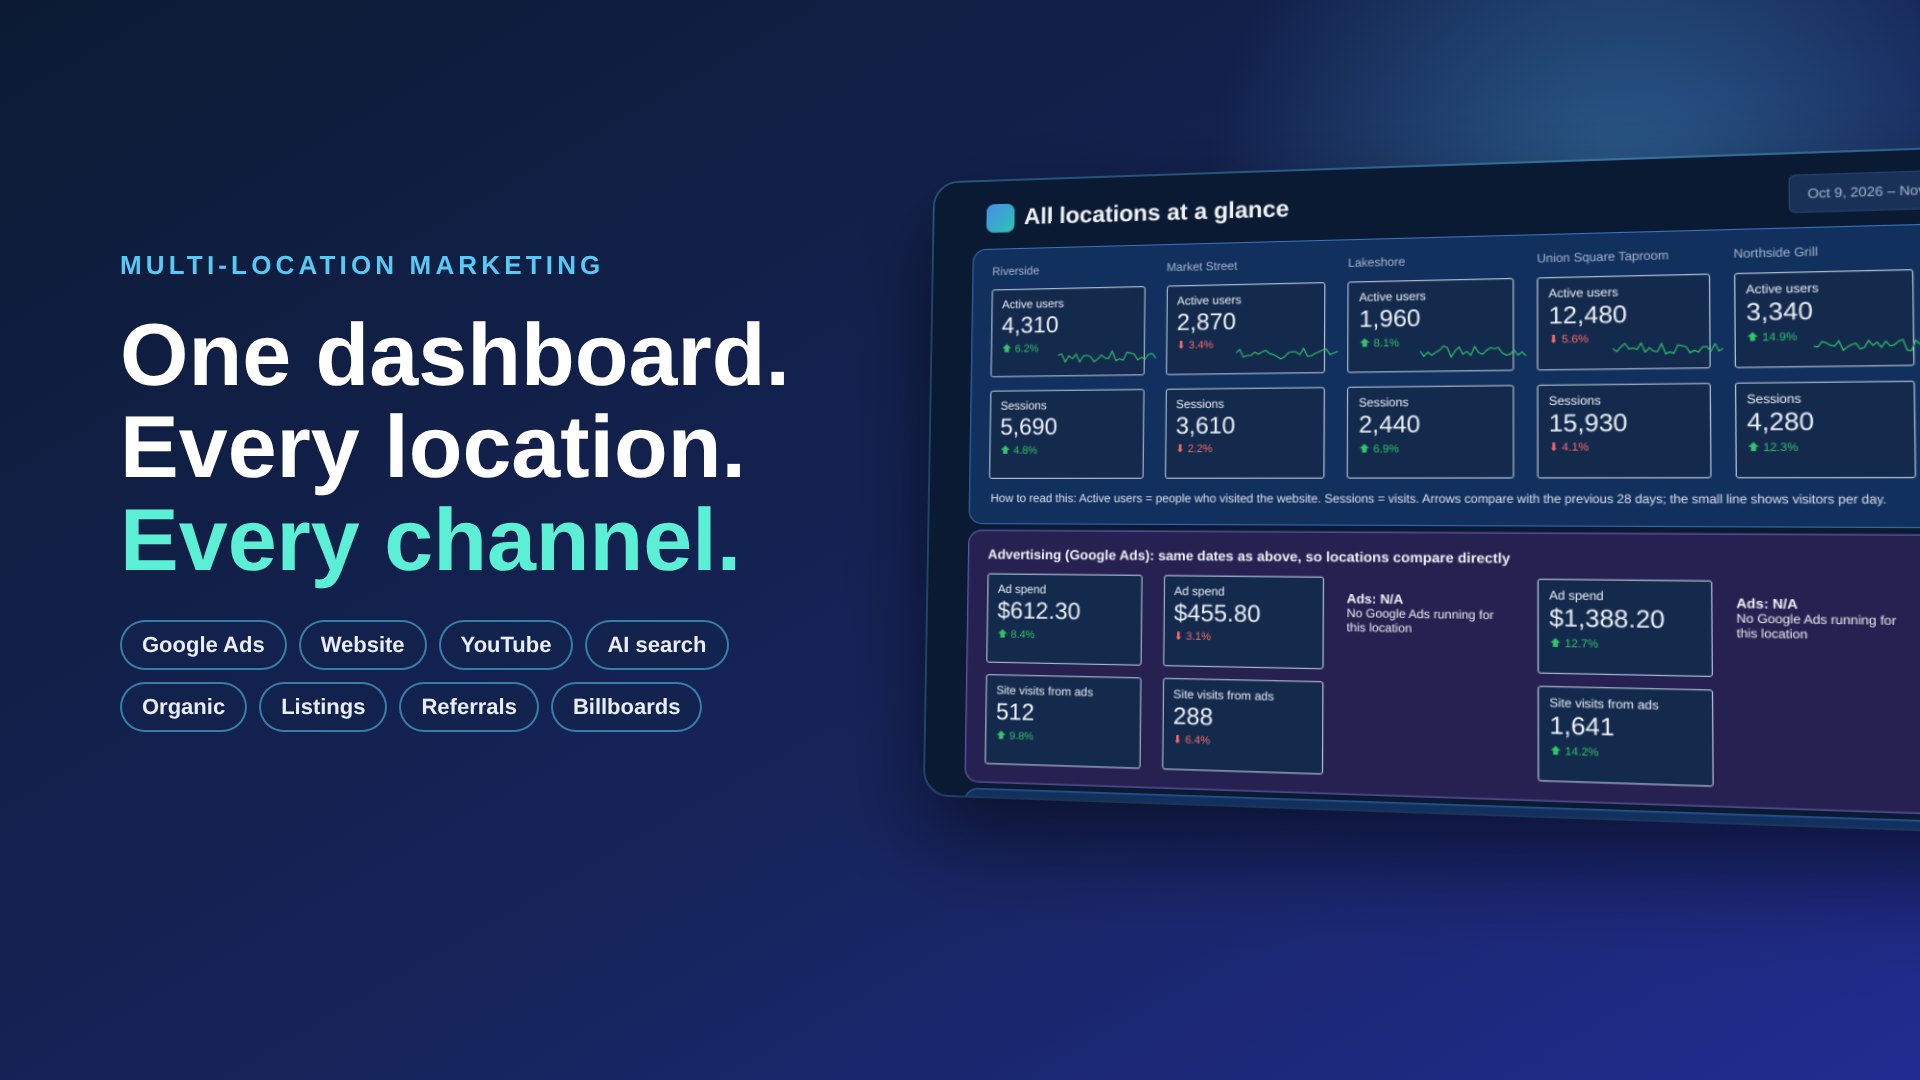
For a small, successful team running several locations or divisions, all of that turns into one question every month: where should the next dollar go? At Xblu, we answer it by pulling every channel into one live dashboard, built around how your business actually runs.
Paid, organic, AI, social, listings, referrals and offline channels all feed one dashboard that updates itself.
The problem: plenty of data, very few answers
Every platform is happy to tell you how well it’s doing. None of them tell you how it compares to everything else you’re paying for, and none of them split the picture by location the way you think about your business.
So someone on the team logs into six places, exports a pile of spreadsheets and tries to line up the dates. By the time it’s done, the numbers are a month old, and the conversation about budget is still mostly gut feel.
Eight tabs, three spreadsheets, no answer
One link, always current
How we approach it: the business first, then the data
A dashboard is only useful if it answers the questions you actually ask. So we don’t start with charts. We start with how you operate: what a good day looks like, what counts as a win, where the money goes and who needs to see what.
Learn how you run
What counts as a win: a reservation, a call, a booking, a walk-in. Who needs to see what.
Map the money
Every channel and every location, online and offline, and what each one costs.
Connect the sources
APIs, live connectors, daily imports, tracked numbers and codes for offline media.
Go live
One color-coded link with plain-English notes, refreshed every day without anyone touching it.
Every channel, one view
Marketing isn’t just ads anymore. People find you through video, organic search, review sites, AI assistants, friends, partners and the sign they drive past every day. We bring all of it together, and we tie it back to what you spend.
Paid search & display
We track: Spend, clicks, calls and conversions by campaign and location
How it gets in: Google Ads, live connector
Website
We track: Visitors, bookings, form fills, menu and page views
How it gets in: Google Analytics 4 and Tag Manager events
YouTube & video
We track: Views, watch time and site visits after viewing
How it gets in: YouTube and Google Ads video data
AI search
We track: Visits from ChatGPT, Gemini, Perplexity and Copilot, and how often you get recommended
How it gets in: Analytics referral segments plus regular AI visibility checks
Organic search
We track: Searches you show up for, clicks and position
How it gets in: Google Search Console
Social
We track: Reach, clicks, messages and paid social spend
How it gets in: Meta and other platform data
Online listings & reviews
We track: Views, directions, calls and website taps on Google, Yelp, Facebook and Bing
How it gets in: Daily automated import from your listings platform
Referrals
We track: Visits and bookings from partner sites, press and word of mouth
How it gets in: Analytics referrals and coded links
Concierge & partners
We track: Guests sent by hotel concierges, planners and partners
How it gets in: Unique codes, partner links and booking notes
Billboards, print & radio
We track: Calls, visits and redemptions tied to each placement
How it gets in: Tracked phone numbers, QR codes, short URLs and promo codes
Offline channels get the same treatment as online ones. A tracked phone number or QR code turns a billboard into a line on the dashboard.
What it looks like: a six-location example
Below is a working demo for a fictitious restaurant group, Harbor & Vine Hospitality. The names and numbers are made up, but the layout mirrors what we build for clients: color-coded sections for the website, advertising and online listings, with every location side by side.
Go ahead and click around. Switch the date range, pick a location or click a bar.
Try it: pick a date range or a location. Every number updates, just like the real thing.
Spend next to results is where the answers are
Once every channel sits on the same page with its cost, patterns jump out that no single platform would ever show you. The channel with the flashiest report might be the one quietly eating the budget. The cheap, boring one, like keeping your listings sharp or rewarding the concierges who send you guests, might be doing the heavy lifting.
That’s what makes reinvesting feel less like a gamble. You can see which channel and which location earns its budget, then move money with confidence.
An illustrative example. When each channel's share of the budget sits next to its share of bookings, calls and visits, the next move is obvious: shift money from the coral rows toward the green ones.
Built once, keeps populating
The hard part is the setup: understanding the business, connecting the sources and deciding what matters. After that, the dashboard runs itself. We use Google’s tools (Looker Studio, Google Analytics 4, Tag Manager, Search Console and the Google Ads and YouTube data) plus APIs and automated daily imports for everything else, including listings platforms, call tracking and offline spend.
Add a new location, a new channel or a billboard campaign, and it becomes another line on the same page instead of another report.
Your channels
Ads, web, video, AI, social, listings, offline
Connectors & imports
Live APIs plus daily automated pulls
Clean data
Organized by date, location and channel
Looker Studio
Color-coded, interactive dashboard
Your team
One link on any phone or laptop
Every morning the new numbers arrive on their own. Nobody exports, copies or pastes anything.
Who this is for
This approach fits best when a few of these sound familiar:
- You run several locations, brands or divisions and want to compare them fairly
- You spend across many channels: search, social, YouTube, listings, referrals, concierge, print or billboards
- You have a small, successful team without time to stitch reports together
- You want to know where to reinvest: which channel, which location, and how much
Let's see what your numbers are saying
We start with a short conversation about how your business runs and where your marketing dollars go. Then we show you what a dashboard built around your numbers could look like.
Book a call with Xblu →